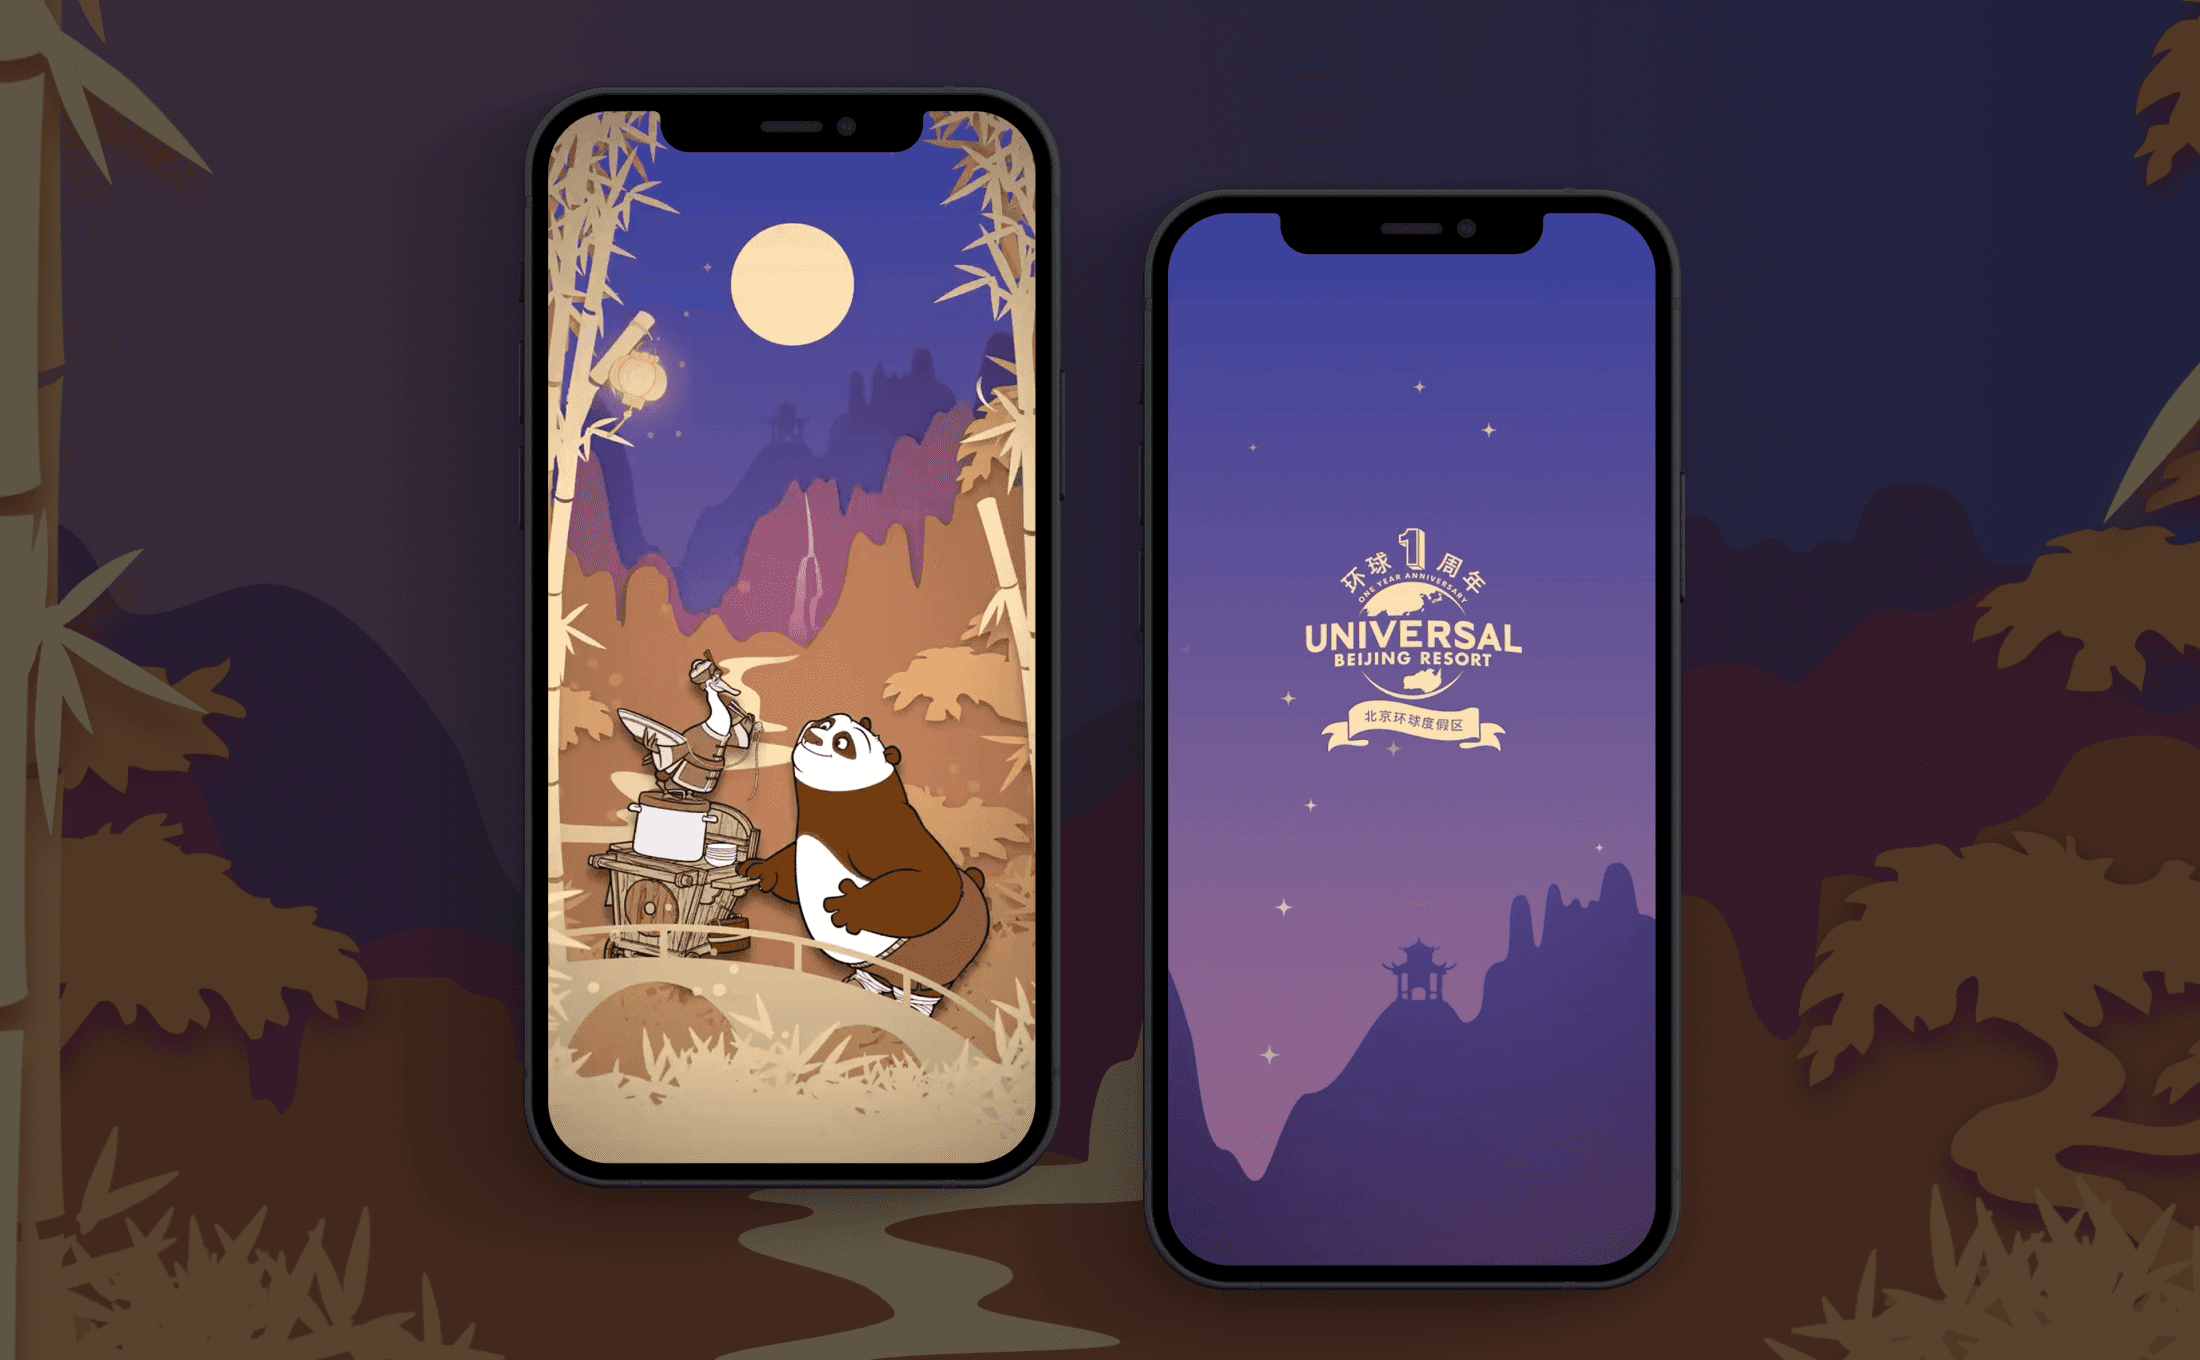
Time
Sep. 2022
Role
Graphic Designer
Collaborator
Stone Chen
Yin Wang
Tools
Sketch
Photoshop
UBR 1st Anniversary Big Data
From August 2022 to May 2023, I worked as the UX & Product Design Intern at Universal Beijing Resort (UBR), contributing to the product, system and UXUI design for UBR's B2C website and application.
UBR's First Anniversary Big Data is an infographic presentation of the most exciting and memorable moments and data from the park's first anniversary, which evokes fond memories for visitors and helps UBR's employees to discover the value of their work. I worked mainly on icon design and graphic design in this project
Impacts
Considerable number of users' like
Published on Weibo & WeChat public platforms with a total reading volume of 10w+ and 500+ likes
Background
The 1st anniversary of UBR
September 2022 is the 1st anniversary of UBR's opening. In order to celebrate this grand occasion, and also to increase the user stickiness, the marketing team would like to publish our ‘First Anniversary Big Data Moments’ on all major social media platforms. Therefore, our design team undertook the visualization of the data messages.
Design Demand
Disassemble information and visualize the 1st big data of UBR
Design ideation
What's in Big Data?
The data information content includes the number of tourists, the number of performances, the number of goods sold, the number of resources used and so on, how to visualize the big data is a key issue.
Find data commonalities
I analyzed the characteristics of these data and found that they can basically be summed up in numbers + markers + landmarks. Therefore, I tried to use the path as the main element to guide users view through the year's big data, where each piece of data is a milestone.
Icon Design
"Design the marker"
Depending on the content of the marker for each message, I created different icons:
Graphic Design
Design illustration
The design strategy is follow "numbers + markers + landmarks" schema. In the following examples, you can use colors to match the corresponding data.
Final design
The overall design is presented in the form of a roadmap, containing a header and footer. In order to better maintain visual consistency and convey the attribution of information, I made the number and marker of each data keep the same color.


